
How to Read Google Analytics 4: A Beginner Guide
You log in, and the screen fills up with a report called "Engagement overview," a graph you don't recognize, and a sidebar with terms like "Events," "Conversions," and "Explore." None of it matches what you remember from the old Analytics. So you click around for two minutes, find nothing that tells you which blog post actually worked last week, and close the tab. You tell yourself you'll figure it out later. Later never comes.
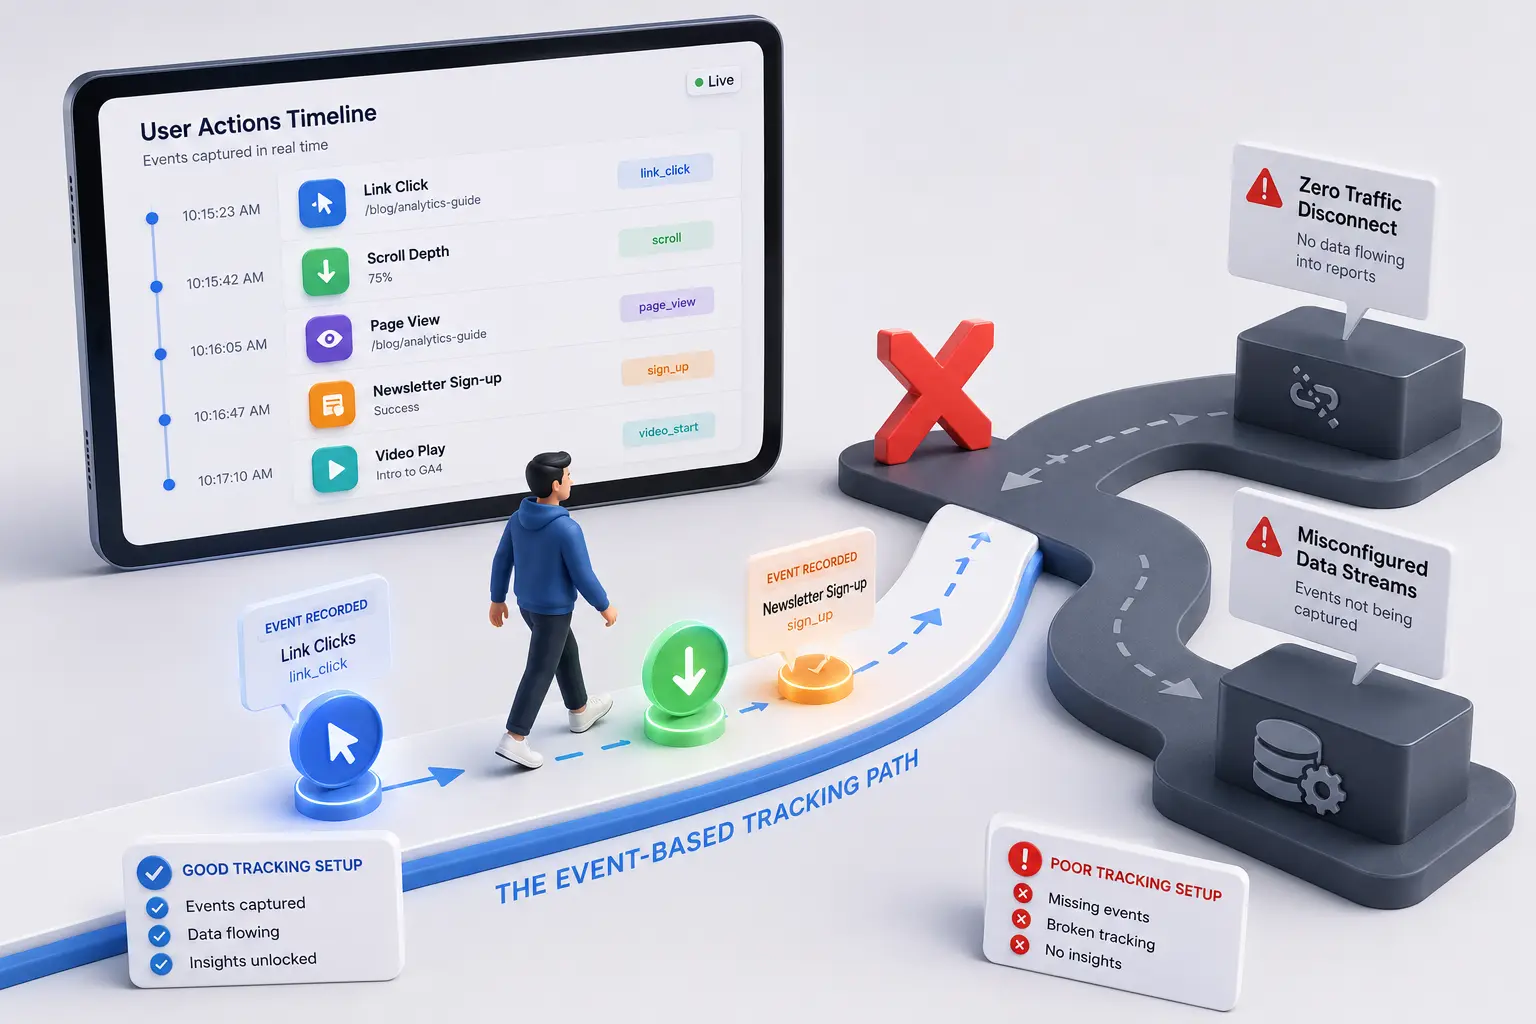
That confusion isn't a sign you're bad with numbers. Google rebuilt Analytics from the ground up when it launched GA4, and the old model, the one built around "sessions" and "pageviews," got replaced with something closer to how apps track behavior: everything is an "event." A pageview is an event. A scroll is an event. A click on an outbound link is an event. This shift makes GA4 more flexible, but it also means every report you used to know how to read now works differently, and nobody handed you a translation guide when Google made the switch.
This guide is that translation. You'll learn what an event actually is, where to find the reports that matter for a blog or content site, how to read traffic sources without getting lost in acronyms, and how to set up simple conversion tracking for things like affiliate clicks and newsletter signups, all using the exact menu paths inside GA4 so you're not guessing where to click.
The GA4 Core Shift: Understanding Events vs. Sessions
Why Google Analytics 4 Tracks Actions Instead of Visits
Universal Analytics, the version most bloggers grew up with, was built around the "session," a block of time a visitor spent on your site, and the "pageview," a single page they loaded during that session. Everything else was secondary. GA4 flips that. It treats every single thing a user does as an event, and pageviews and sessions become just two types of events among many.
Why the change? Because people don't only browse websites anymore. They also use apps, and Google wanted one measurement system that works the same way whether someone is reading your blog in a browser or scrolling inside a mobile app. Tracking discrete actions, rather than time-based sessions, is what makes that possible. The side effect for a blogger is that you now get automatic data on things Universal Analytics never tracked well, like how far someone scrolled or whether they clicked a link that took them off your site.
What Counts as an "Event" in GA4?
An event is any recorded action. GA4 auto-tracks several without you setting anything up, including page_view (someone loads a page), scroll (someone scrolls past 90% of a page), click (someone clicks a link that leads to a different domain), file_download, and video_start or video_progress if you've embedded video. You can find the full list by going to Admin > Data display > Events, or by opening the Reports > Engagement > Events report, which shows every event GA4 has logged for your property along with how many times each one fired.
You can also create custom events for anything GA4 doesn't track by default, like a click on a specific button. For a beginner blog, though, the built-in events already cover most of what you need to know: who showed up, what they read, and what they clicked on next.
The New Meaning of "Engagement Rate" vs. Bounce Rate
If you remember Universal Analytics, you remember bounce rate: the percentage of visitors who left after viewing just one page, with no other action. A high bounce rate felt like a bad sign, even though plenty of blog readers land on a post, read the whole thing, and leave satisfied, which Universal Analytics still counted as a "bounce."
GA4 replaced this with engagement rate, which flips the logic. A session counts as "engaged" if it lasts 10 seconds or longer, includes a conversion event, or includes at least two pageviews. Engagement rate is the percentage of sessions that meet one of those conditions. So a high engagement rate is good, the opposite of how bounce rate worked. GA4 does still show a bounce rate metric if you go looking for it (it's just 100% minus engagement rate now), but engagement rate is the number worth watching, because it actually reflects whether people stuck around.
Navigating the GA4 User Interface Without Getting Lost
The Home Dashboard: Your Real-Time Traffic Snapshot
When you log into GA4, you land on the Home screen. This is a rough overview, not a deep-dive tool. It shows cards for users in the last 30 minutes, top countries, top pages, and a few other snapshots. Treat it as a pulse check, the kind of thing you glance at to confirm your site is getting traffic at all, not the place you go for real analysis. If you published a post an hour ago and want to see if anyone's reading it right now, the "Users in last 30 minutes" card on the Home screen is the fastest way to check.
Finding the Reports Snapshot and Library
The real reporting lives under the Reports icon in the left sidebar, the one that looks like a bar chart. Click it, and you land on Reports snapshot, a slightly more detailed overview than the Home screen, with graphs for user acquisition, engagement, and monetization if you have it set up.
Below Reports snapshot, you'll see a list: Realtime, Life cycle, and User. Life cycle expands into Acquisition, Engagement, Monetization, and Retention, and each of those expands further into specific reports. If you don't see a report you're expecting, click Library at the very bottom of the left sidebar. This is where GA4 lets you add or remove entire report collections, in case one got hidden during setup.
Customizing Your Left Navigation Menu for Quick Access
You don't have to click through four menus every time you want to check your top pages. Go to Library, find the collection you use most (usually "Life cycle"), and click the pencil/edit icon on it. From there you can drag specific reports, like "Pages and screens" or "Traffic acquisition," to the top of your navigation, or remove reports you never open. Click Save when you're done. Five minutes spent here now saves you real time every week, since you'll stop hunting for the same two or three reports over and over.
Tracking Traffic Acquisition: Where Do Your Visitors Come From?
Acquisition Overview: Traffic Channels vs. Source/Medium
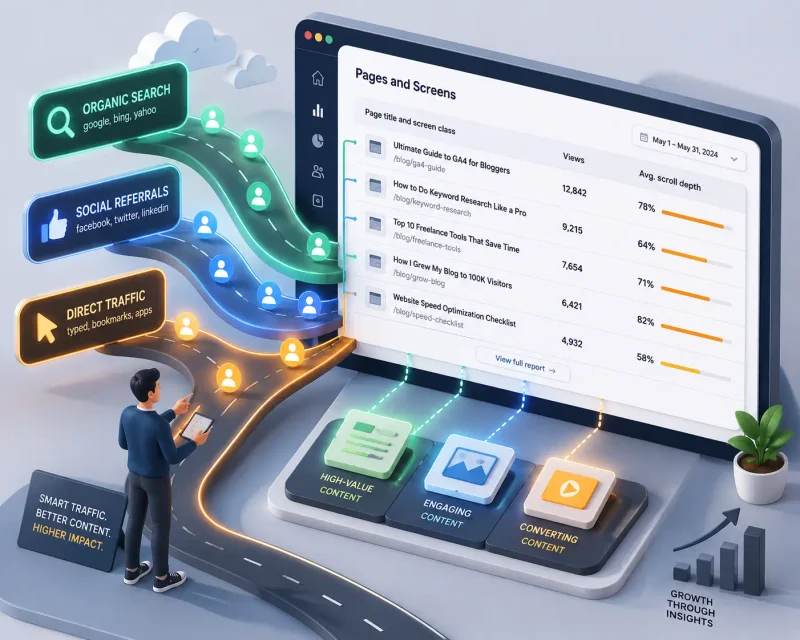
Go to Reports > Life cycle > Acquisition > Traffic acquisition. This report groups your visitors into "Default channel groups," broad categories like Organic Search, Direct, Referral, Organic Social, and Paid Search. It's the fastest way to answer "where is my traffic coming from" without drowning in detail.
If you want more precision, switch the primary dimension at the top of the table from "Session default channel group" to "Session source / medium." This breaks traffic down into its raw components, like google / organic or facebook.com / referral, so instead of a vague "Organic Social" bucket, you see exactly which platform sent the click. Use the channel groups for a quick weekly glance, and the source/medium breakdown when you need to know exactly which platform or search engine deserves credit.
Identifying Organic Search Traffic from Google
In the Traffic acquisition report, look for the row labeled Organic Search under channel groups, or google / organic under source/medium. This is anyone who found you through an unpaid Google (or Bing, or another search engine) search result. If you want to see which search queries actually brought people in, you'll need to connect Google Search Console to your GA4 property under Admin > Product links > Search Console links, since GA4 on its own doesn't show the exact search terms people typed.
If organic search traffic is thin, pairing this report with a rank tracking tool can help you see which keywords you're actually ranking for before you invest time chasing new ones. Our guide to free rank tracking tools for bloggers walks through a few solid options.
Tracking Referral Traffic and Social Media Inbound Links
Referral traffic is anyone who clicked a link to your site from another website that isn't a search engine, think a mention in someone else's blog post, or a link in a newsletter. Organic Social covers unpaid clicks from platforms like Facebook, X, LinkedIn, or Pinterest.
One catch worth knowing early: links shared inside apps like Instagram or TikTok sometimes get logged as "Direct" traffic instead of "Referral" or "Organic Social," because those apps strip referral information before handing the click off to your site. If your Direct traffic number looks unusually high and you've been posting on social platforms, this is often why. It's not a bug in GA4, it's just a limitation of how in-app browsers pass data.
Analyzing Engagement: Which Pages Do Your Users Visit Most?
Navigating to the "Pages and Screens" Report
Go to Reports > Life cycle > Engagement > Pages and screens. This report lists every page on your site, ranked by views, with columns for users, average engagement time, and event count. It's the report to check when you want to know which posts are actually pulling their weight. Click any page title in the list, and GA4 lets you filter the whole report down to just that page's data.
Measuring Average Engagement Time Per Page
The "Average engagement time per active user" column tells you how long, on average, a page stayed in focus on someone's screen while they were actively interacting with it (not just idling in a background tab). This is a better read on content quality than pageviews alone. A post with fewer views but a long average engagement time is holding attention; a post with huge traffic but a 15-second average engagement time is probably a headline that overpromised.
Tracking User Scroll Depth and Outbound Clicks Automatically
Remember the scroll and click events from earlier? You can see them here too. Filter the Pages and screens report, or check the Events report directly, and look for scroll events tied to a specific page to get a rough sense of how many readers made it 90% of the way down a post. Outbound clicks (visits to a link that leads off your domain, which matters a lot if you run affiliate links) show up as click events. GA4 tracks both automatically, with no extra setup required, which is one of the genuine upgrades over the old Universal Analytics setup.

Understanding Your Audience: Demographics and Tech Data
Finding Geographical Data: Where Your International Readers Live
Go to Reports > User > User attributes > Demographic details. This report breaks your audience down by country, city, and even language settings. If you write for a mixed audience, say a blend of readers in Pakistan, the US, and the UK, this report will tell you exactly how that mix looks in practice, which is useful when you're deciding what time zone to schedule posts for or which examples and currencies to use in your writing.
Analyzing Tech Reports: Mobile Users vs. Desktop Users
Go to Reports > User > Tech details. This shows the breakdown of device category (mobile, desktop, tablet), operating system, browser, and even screen resolution. For most blogs today, mobile traffic makes up more than half of all visits, and if that's true for your site too, it's worth checking that your theme, images, and any embedded tools actually work well on a small screen, since this report will confirm it either way instead of leaving you to guess.
Using Demographics to Better Tailor Content for Your Audience
None of this data is useful sitting in a report. Cross-reference it with your Pages and screens report: if readers from a specific country are spending far more time on certain posts, that's a signal to write more of that kind of content for that audience. If a large chunk of your traffic is mobile but your average engagement time on long posts is low, that might mean your formatting needs shorter paragraphs and more subheadings for a phone screen, not necessarily shorter articles.
Setting Up and Tracking Simple Conversions in GA4
Turning Standard Events Into Conversions with One Click
A "conversion" in GA4 is just an event you've flagged as meaningful, something you actually want to happen, like a newsletter signup or an affiliate click. Here's exactly how to mark one:
- Go to Admin (the gear icon, bottom left of the sidebar).
- Under the "Property" column, click Events.
- Find the event you want to track (for example,
clickor a custom event you've already set up). - Toggle the switch under the "Mark as conversion" column, next to that event.
That's it. No code, no tag manager required, as long as the event is already being tracked. Give it 24 to 48 hours, and the event will start showing up under Reports > Life cycle > Engagement > Conversions.
Tracking High-Value Affiliate Link Clicks
Since GA4 automatically logs outbound link clicks as click events, you can mark that event as a conversion using the steps above. But if you want to track affiliate clicks specifically, separate from every other outbound click, you'll want a bit more precision. Go to Admin > Data display > Events, click Create event, and set up a custom event that fires only when the link URL contains your affiliate domain (most affiliate networks use a consistent URL pattern, like amzn.to or a specific tracking parameter). Once that custom event exists and starts collecting data, mark it as a conversion the same way as above.
Monitoring Newsletter Sign-Up Form Submissions
If your newsletter signup redirects visitors to a "thank you" page after they submit the form, the easiest method is to create a custom event based on that page path. Go to Admin > Data display > Events > Create event, name it something like newsletter_signup, and set the matching condition to page_location containing your thank-you page URL (for example, /thank-you-subscriber). Mark it as a conversion, and from then on, every time someone lands on that page, GA4 logs it as a signup.
If your signup form doesn't redirect anywhere and just shows a confirmation message on the same page, you'll need a small amount of Google Tag Manager setup to fire an event on form submission specifically. That's a more advanced step, and if you're building out your content with data-backed claims in general, it's worth reading our piece on adding statistics to AI-assisted content once your tracking is in place, so the numbers you cite are ones you actually collected yourself.
- Why is my Google Analytics 4 data showing zero traffic?
- Usually one of three things: the tracking code isn't installed correctly on your site, you're checking the report too soon (GA4 can take 24 to 48 hours to process data after setup), or you're looking at the wrong date range. Check Admin > Data streams to confirm your site's tracking tag is active, and use the Realtime report to test whether visits are logging at all before assuming something is broken.
- What is a good engagement rate in Google Analytics 4 for a blog?
- Most content blogs land somewhere between 50% and 70%. Anything above 60% is generally solid for a site built around reading long-form posts. If your engagement rate sits below 40%, it's worth checking your page load speed and whether your intro paragraphs actually match what people expect from your headlines and search snippets.
- How long does it take for data to show up in GA4 reports?
- Realtime data appears within a minute or two. Standard reports, the ones under Life cycle and User, typically take between 24 and 48 hours to fully process. This delay is normal and isn't a sign of a tracking problem.
- What is the difference between "User Acquisition" and "Traffic Acquisition" in GA4?
- Traffic Acquisition groups every single session by how it arrived, so one returning visitor can show up multiple times under different channels. User Acquisition instead groups each individual user by the channel that brought them to your site the very first time, even if they've come back since through a different route. For most blogging questions, like "where did this week's traffic come from," Traffic Acquisition is the more useful report.
- Do I need to be a developer to set up GA4 on my website?
- No. If your site runs on WordPress, most page builders and SEO plugins let you paste your GA4 Measurement ID directly into a settings field. Platforms like Squarespace, Wix, and Shopify have a dedicated field for it too. Custom conversion events with URL conditions, the kind covered above, also don't require code. You'll only need a developer or Google Tag Manager for more advanced tracking, like firing an event on a form submission that doesn't redirect to a new page.
Action Plan: Your 5-Step Weekly Data Review Routine
Checking GA4 shouldn't take more than 15 minutes if you know exactly where to look. Run through this every week:
- Check engagement rate. Go to Reports > Life cycle > Engagement > Overview. Note whether it moved up or down from last week.
- Review Pages and screens. Identify your top three posts by views and your top three by average engagement time. They're often not the same posts, and that gap tells you something.
- Scan Traffic acquisition. Confirm which channel sent the most visitors, and check whether that matches where you actually spent your time promoting content that week.
- Check Conversions. Look at your newsletter signup and affiliate click totals for the week, and compare them against the posts that drove the traffic.
- Note one change to make. Based on what you saw, pick one small adjustment, a headline to test, a post to promote more, a page to fix, and act on it before your next check-in.
Related Articles
Explore the Digital Marketing hub →
Email Marketing Basics for Content Creators
The only audience a platform can't delete overnight is the one whose email addresses you actually own.
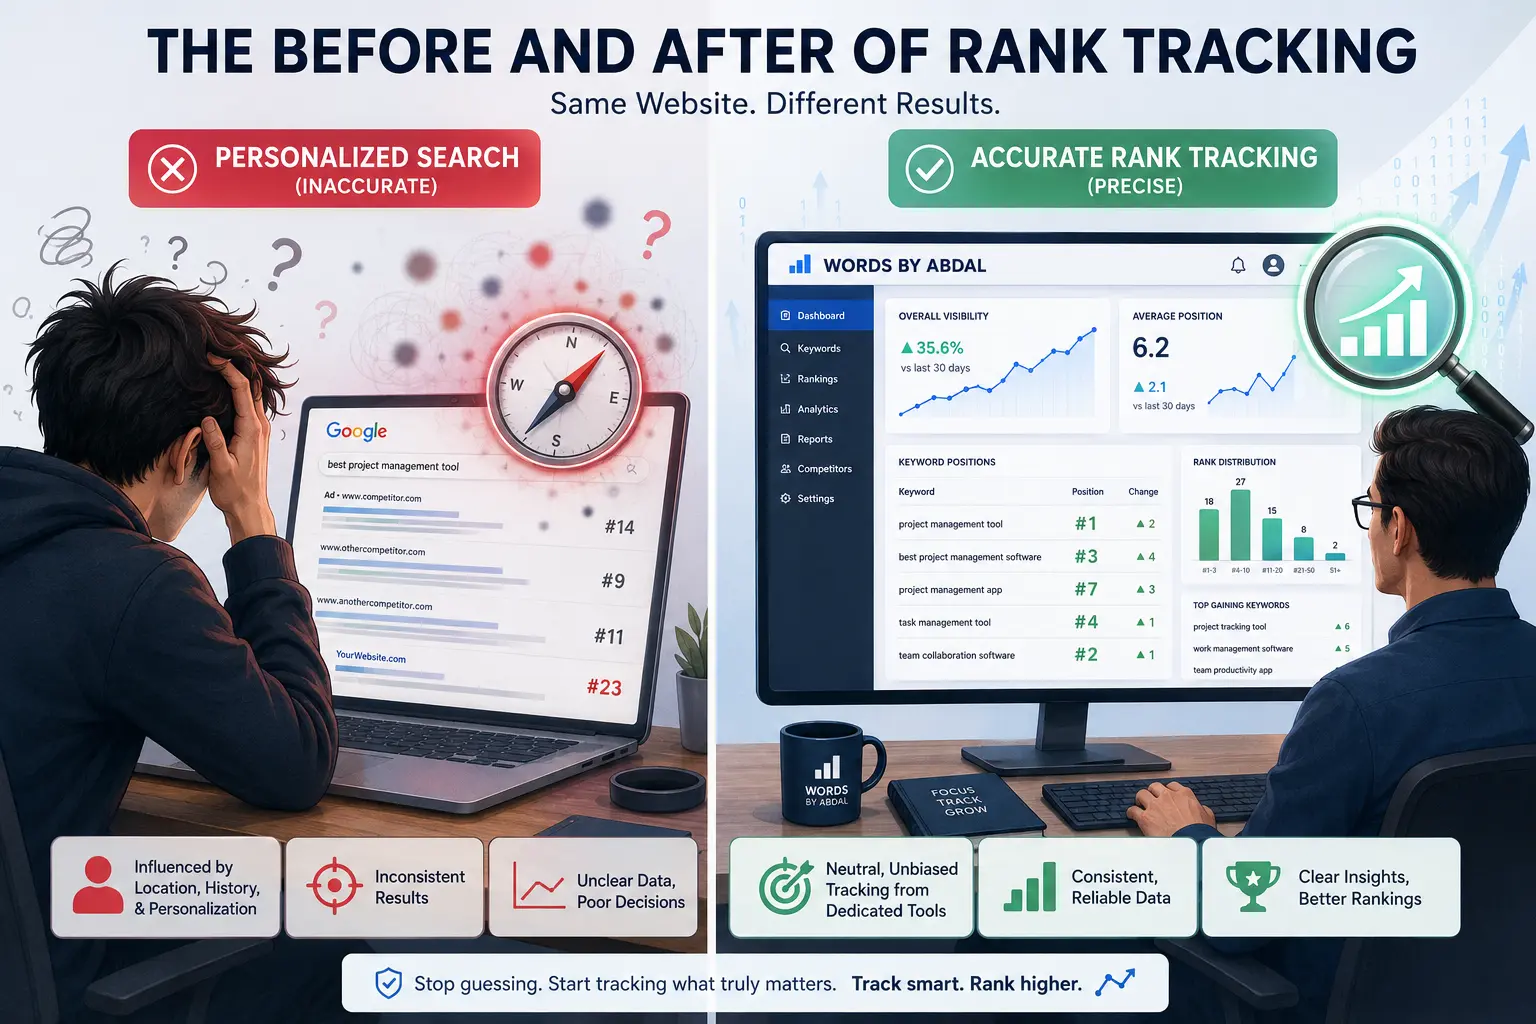
9 Best Free Rank Tracking Tools for Bloggers (2026)
Manual Google searching lies to your face — here are the six free rank trackers that actually show where your blog stands in organic search.

Affiliate Marketing with Zero Audience: A Beginner Guide
You don't need followers to make affiliate marketing work, you need people who are already searching for what you're selling.